


Teaching data and graphing in special education classrooms can sometimes feel overwhelming. With the right tools and strategies, it becomes much more manageable. In fact, once students are given engaging, hands-on opportunities to explore data, they can develop essential skills. Including in reading bar graphs, line graphs, and pictographs. Plus, these activities help them meet their IEP math goals in a meaningful way.
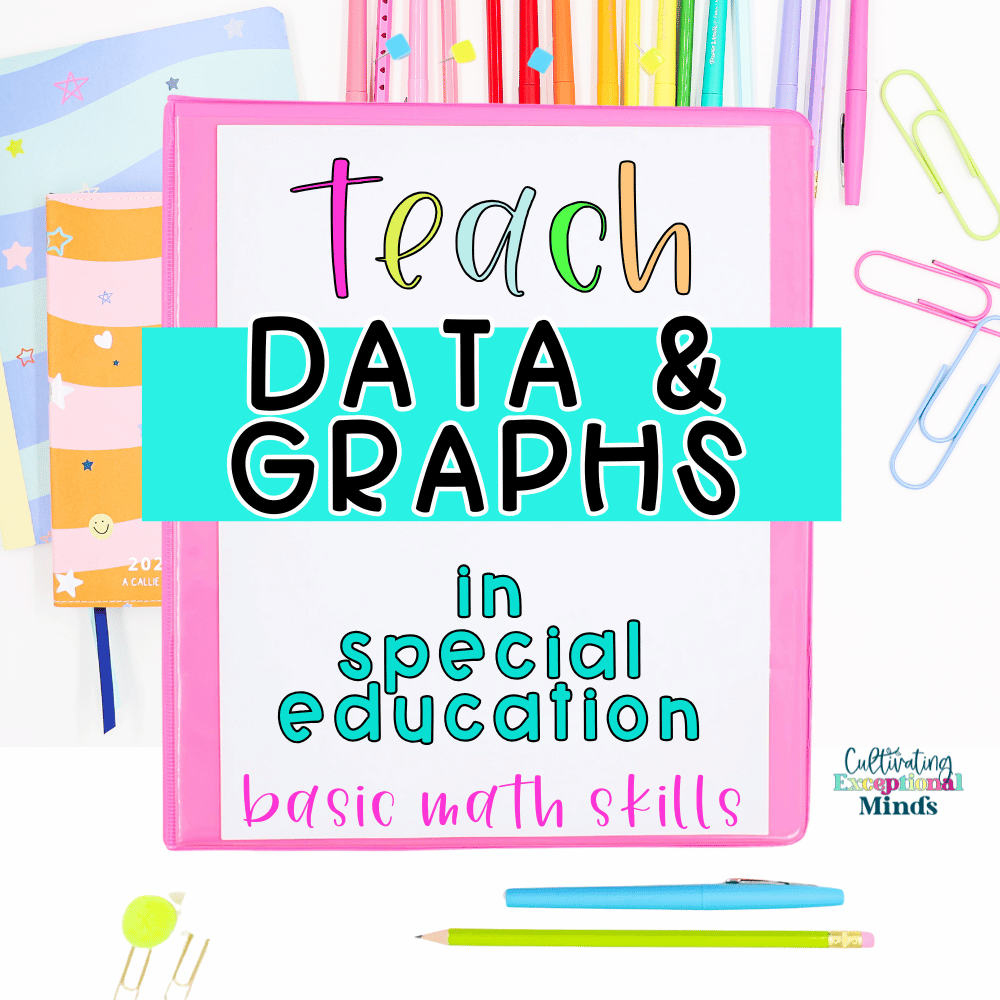
This comprehensive Data and Graphing in Special Education Classrooms Math Unit is a game-changer for special education teachers. Whether your students are just beginning to sort objects by category or are ready to interpret more complex graphs. This resource is designed to support learners of all abilities. With structured, differentiated activities, every student can build confidence in their math skills.
Why Focus on Data or Graphing?
It’s important to remember that graphs and data analysis aren’t just math skills—they’re life skills! From understanding sports stats to making sense of charts in everyday situations. Teaching students how to interpret data equips them for real-world success. For students in self-contained classrooms, incorporating hands-on, engaging activities ensures that learning remains accessible and effective.
Furthermore, when students practice data and graphing in special education classrooms, they strengthen problem-solving, critical thinking, and decision-making skills. By giving students multiple ways to interact with information, you provide them with the tools they need. This includes the ability to analyze and understand the world around them.
What’s Included in the Unit?
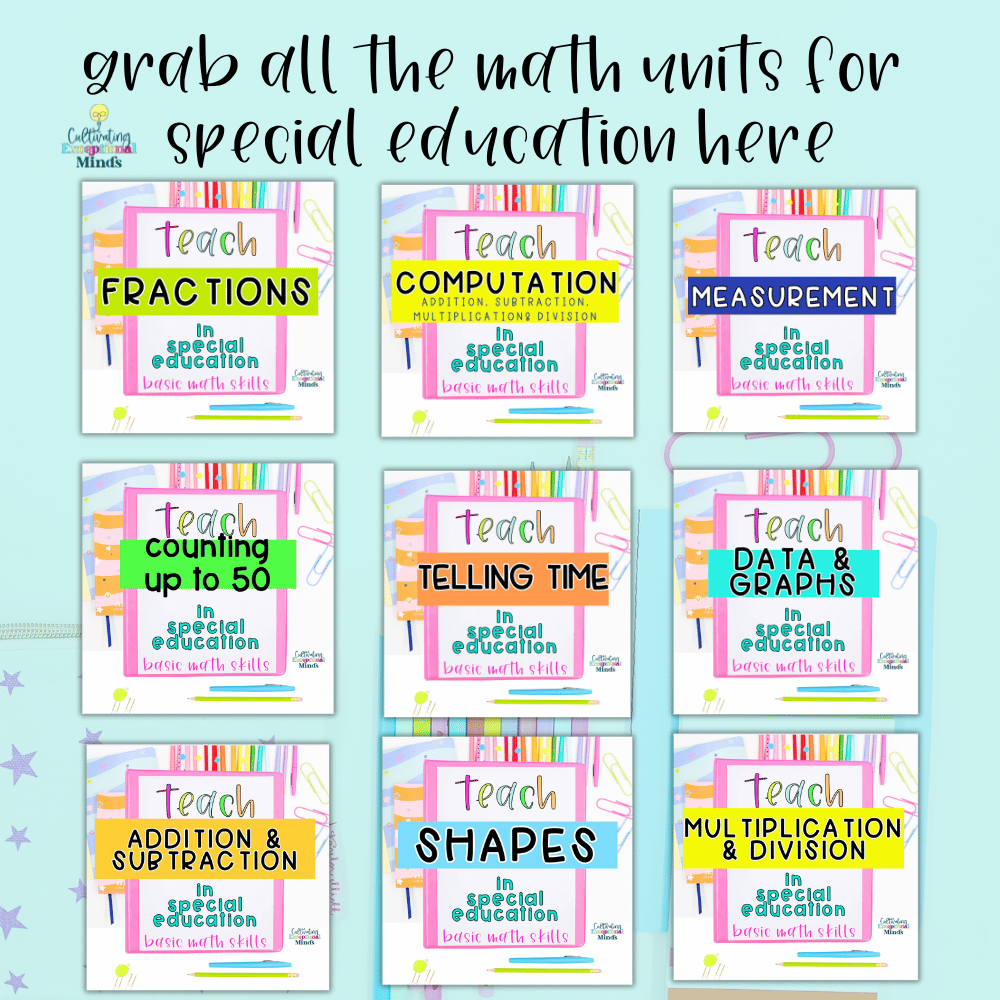
This all-in-one special education math curriculum includes:
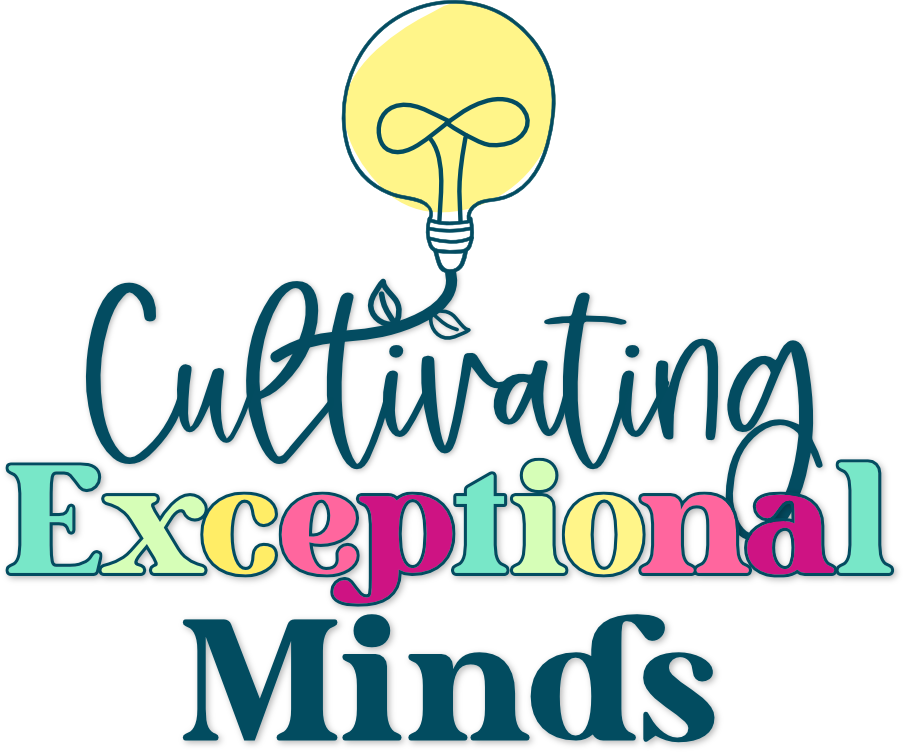
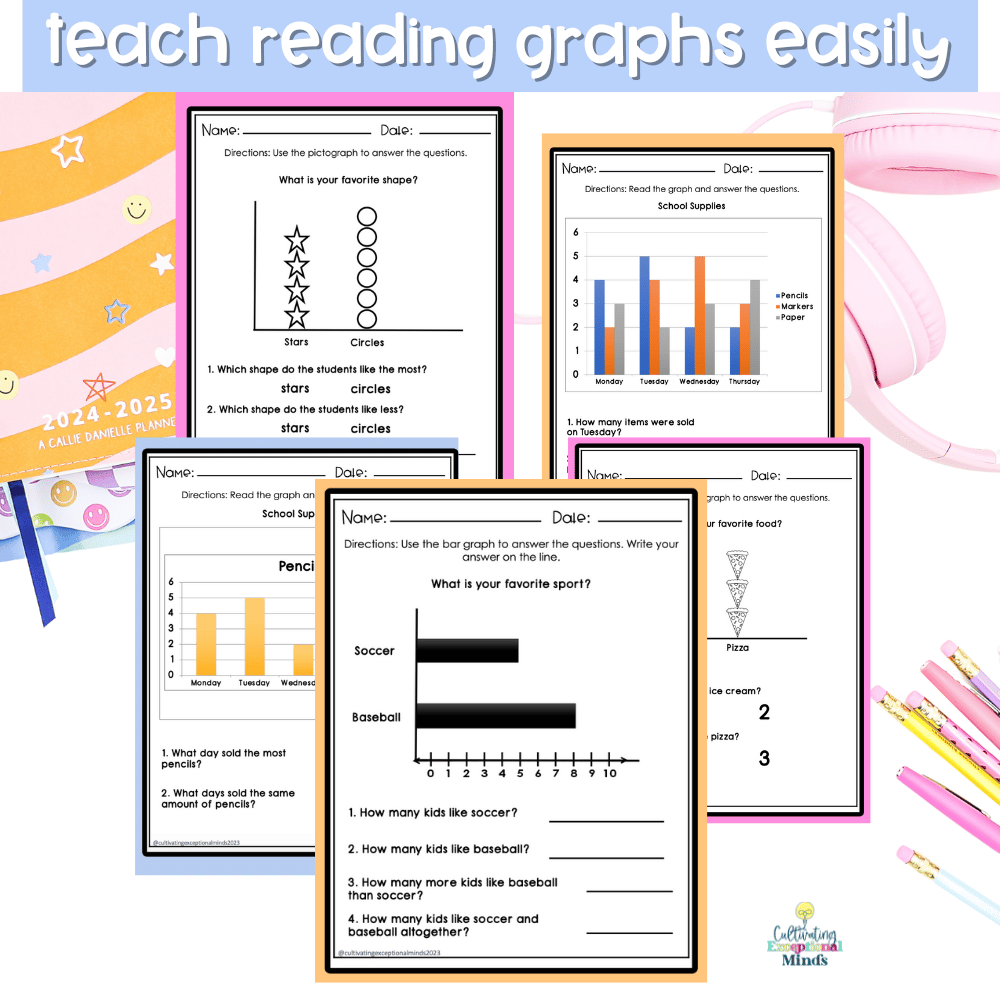
- ✅ Bar Graph Activities – Students practice analyzing data points to answer real-world questions.
- ✅ Pictographs – Fun, colorful visuals help students count and compare quantities in an engaging way.
- ✅ Sorting Tasks – Foundational skills are reinforced as students categorize objects by size, shape, or type.
- ✅ Progressive Complexity – Activities start with simple concepts and gradually increase in difficulty, making differentiation seamless.
- ✅ Over 50 Pages of Resources – Low-prep, high-impact activities are specifically designed for special education classrooms.
Tips for Using This Unit Effectively
To get the most out of this unit, consider these practical strategies:
- 🔹 Start Simple – Begin with sorting and pictographs to help students build confidence before moving on to bar graphs and more complex data analysis.
- 🔹 Incorporate Real-Life Contexts – Use relatable examples, such as favorite foods, weather patterns, or classroom votes, to make graphs more meaningful.
- 🔹 Use Visual Supports – The included visuals help scaffold instruction, especially for students who may need additional support in grasping abstract concepts.
- 🔹 Monitor Progress Regularly – Track student growth with the provided data sheets and rubrics, ensuring they are making measurable progress toward their IEP goals.
Bonus Freebie: Try a 4-Page Sampler!
Want to see how this unit fits into your classroom before diving in? Download our free data and graphing sampler to explore activities like pictographs and sorting exercises. This sample will give you a taste of how easy it is to implement. These strategies in data and graphing in special education classrooms. Added bonus it allows you to teach without added prep time.
Keep the Learning Going Year-Round
This unit is just one part of a larger, comprehensive special education math curriculum. By consistently integrating graphing activities into your lessons, you can create a well-rounded math program. This keeps students engaged and making progress.
If you’re ready to simplify math instruction while ensuring student success, then do this. Explore the full Data and Graphing in Special Education Classrooms unit today and watch your students thrive! for more math ideas in special education classrooms check this blogpost out.